Browsing posts in: Uncategorized

Sufferin’ Summits 2023 – A New Hope

One of my non-resolutions of late is that I would try to write more – or any – and that I would specifically try to write more humor, because that is the kind of writing I find to be most challenging and therefore most rewarding.

Just to be clear, that’s rewarding to me, not rewarding to you.

Some have complained in the past about my “self deprecating humor”. Putting aside the possibility that it may be the “humor” part they are actually commenting on, I can understand their sentiment, but I have in fact tried to substitute “shelf deprecating humor” (Ikea product names) and “elf deprecating humor” (funny shoes) but have found that to be too limiting. A more specific complaint was that I was using self deprecation because it’s an easy way to get a laugh (duh) and that my depictions were not accurate.

I recently did a bicycle ride that I believe is powerful evidence in my favor…

You can find the official origin story of Sufferin’ Summits here, but suffice it to say that it’s a very hilly ride that was designed to be right on the edge of what I would find possible *given* my aversion to the kind of training that makes rides possible – training every weekend and working your way up to the distance and elevation gain of your target ride.

Sufferin’ Summit has 8 designated hills. Here’s a graph of my results by year:

image

My only true completion was in 2017, though I’m going to count 2016 as I was really close and it was over 100 degrees and I had heatstroke on the last climb. I should also probably note that in 2018 we cut it short because of smoke from forest fires, rain, and an unseasonal plague of locusts.

As you can see, the median is 5 hills, so there’s no self-deprecation when I talk about my performance on this ride – in the last 5 years I’ve been able to finish 5 hills and that’s pretty much the max. Which is, frankly, a bit disappointing for a ride that I created.

Now that I’ve dispatched with the impression that I’m not realistic in my abilities or performance, we can move onto the ride report…

Early in 2023, I read a book about athletic accomplishment and pushing through even if you have difficulties. I don’t recall the title, it was something like, “Okay, it’s broken, but there’s no bone showing…”. And I decided that this year I was going to actually train for Sufferin’ Summits – which means going out and riding the same hills on training rides in the months before the ride and working a bit more on leg strength during my other rides.

And it was all going great until a Thursday night ride on the 20th of July, in which I was riding in the hills – as one does – with a two of my friends, and I noticed that I was cold and 20% short on my usual ration of Vim and Vigor.

The next day I started to feel sick, and that day or the next my wife tested positive for the Covids.

And for once, I don’t have need to invent an excuse for my performance as instead of spending 7 weeks riding hills and improving my fitness for what I hoped would be my second successful completion, I spend 3 weeks coughing and a further 4 weeks estimating the percentage of lung capacity loss I was experiencing when I was trying to exercise.

Which brings us to the Sufferin’ Summits ride. I already decided not to do the Passport2Pain ride – which honestly is a much better ride than mine – but since I host the ride people expect me to show up and if I show up the least I can do is try to ride the first hill (never let it be said I don’t do the least I can do…)

Saturday the 9th turned out to be a nearly perfect day, with a temp around 55 to start and an estimated high of 80. The only better day would be 60 and overcast.

I had very low expectations. The previous Tuesday my riding group climbed the upper part of the first climb – known as Grand Ridge – and I was okay as long as I didn’t work too hard, so I was pretty sure that the title of this writeup would not be “Sufferin’ Summit”. I was hoping to do 2 hills and though that 3 was a stretch since I know the third hill quite well.

The group of 10 or so left the start at a little after 8, and we rode together to the first hill. My legs feel weird – generally spinning easy on the flats they should feel great, but they don’t. Not foreshadowing, just odd. At the bottom of the first hill, two “faster than me” friends pulled ahead and I knew I would not see them again. Which is fine – this is a self-paced ride and “ride your own pace” is explicitly one of the rules.

Grand Ridge was fine. I suffered up the steep parts – there’s one grade that is 18% IIRC – and was really out of breath and it took me at least 30 seconds to recover, which is just a post-covid symptom, but other than that I felt okay. This is a big climb – a little over 1000’ – but it’s frankly not a super difficult climb, even on the route we take. That’s why it’s the first climb on this ride.

A fast descent and we headed over to Squak Mountain. Our route goes up what I would call “the hard way”, and the first section has undulating sections of 10%-16% that took us about 10 minutes to climb. Like the early steep stuff, I got pretty out of breath. This is a bit of a weird climb in that once you past the lower part, there is one steep section and then the rest of the way it’s pretty manageable. We topped out at the water towers at the top, and I felt okay.

Another quick descent and we headed to Talus.

Talus has a perfectly nice entrance to the development, with a good bike lane up to the midpoint, but it’s not the hardest way up, so Sufferin’ Summits goes up an old road that is/was used to access city property. It’s thin and painfully steep, steep enough that even if I ride very slowly it still requires quite a bit of power. I generally deal with it by whining the whole way up, but with my lungs still below par I found myself at what is technically know as the Maximum Voluntary Ventilation – breathing as hard as I could. It’s that feeling you get while you are recovering from a sprint, but I still have another 4 minutes of climbing and I’m enough on the edge that I’m not sure I can clip out of my pedals.

Keep going and maybe pass out or try to stop and probably fall over? I don’t understand why more people don’t show up for this ride.

I did make it to the top, and then there’s after quick flat spot there’s a short section steeper than 20% and a short slog to the top. Of this side of the development. Then it’s over to the other side of the development, to climb another 300’ to the real top of the development.

At the top I took stock in myself and thought about what the next hills were like, and decided that I needed to be done for the day. I could *maybe* have done the fourth hill, but it would have pushed me to the limit of my current fitness and health and was therefore contraindicated in my opinion.

But at least this time I have a real excuse.

If you care for the Strava for the ride, you can find it here.

Stats

Distance: 19.14 miles

Time: 1:48:18

Elevation Gain: 2792’

Time Climbing: 1:12:22

Average Speed: 10.6 mph


If you


How to become a better skier–improved carving

Here are my thoughts about how I think of becoming a better carver.

You should probably read my earlier posts to understand turn shape and a bit about my philosophy first:

How do I become a better skier? Stance and Turn Shape

How to become a better skier–Recommended exercises

Those posts are targeted at intermediates who want to improve their technique, and improvement there is generally fairly straightforward; fixing the stance and the path works pretty well.

Carving is an advanced skill, and that means it’s probably going to take more work on your part to get there, more time, and a fair bit of introspection about your skiing.

What is carving?

The definition of carving is pretty simple; it is skiing in a way that the skis leave two distinct tracks in the snow, like this

The skis are placed on an edge and the skis carve two parallel tracks in the snow. This happens because of the sidecut of the ski; the front and tail of the ski are wider and therefore touch first when the ski is on edge; put pressure on the middle of the ski and it bends into a curve, and that is what generates the curved path. Less angle and pressure; big radius – more angle and pressure; tighter turn. Different ski designs have different sidecuts and therefore give different turns; you can look at the radius.

Many people extol carved turns as the goal to be a “real” skier, but the reality is that carving is just one technique, one way of turning. At the opposite end of the spectrum are skidded or rotary turns, which are done with very low edge angles and twisting motions.

Both are useful techniques; as much as I like carving there are many situations where I ski blended turns (part carve, part rotary) and some situations where I ski turns that are mostly rotary (off piste, for me).

Zones of Carve and Meh

Looking the top part of this diagram, we have the zone of carve.

Look carefully at the diagram, especially at what we call “ski lead” – where the ski tips are in relation to each other in the zone of carve. The outside ski is farther back than the inside ski, and it is also more heavily weighted with the weight on biased towards the front. As the turn comes off the hill, the uphill skill is naturally in front and that knee is bent.

Getting to this point is the first step for the aspiring carver. In my examples post, the fan progression exercise is a great way to focus on this, to understand the feeling of just letting the skis run and turn at whatever rate they want to turn. Note that the fan progression is a bit antisocial as it takes a lot of width and you are skiing in a way that other people don’t expect, so make sure to look uphill and don’t do it on a crowded slope.

I also like my diagonal sideslip exercise, which allows you to play around with different stances and understand how to get the one you want.

image

In between the zone of carve and the zone of meh, we have the transition from one turn to the other. Notice how the ski lead at the end of one turn continues into the the start (or top) of the next turn.

Why “Meh”? Well, because what we would like to see here is effective turning, but what we really see here is a lot of meh that continues until we are back at the fall line, at which point the skis and skier are in a state where they can effectively carve. Two things are common to see here; the first is that the skier is using rotary turning to get the skis turned so they are down the fall line, and it’s also common to see a transition that takes a *long* time.

It’s a little like what we see in the Z turns I talked about before, though a much less extreme version of that motion.

Why is there no carving here? It’s pretty simple; in the carve zone, I said that the outside ski was farther back and the front of it was weighted. In the meh zone, the new outside ski is out in front and that makes it impossible to have the front weighted. It also typically means that the weight hasn’t shifted to the new outside ski – the old outside ski still has most of the weight. So you just meh along until that change happens and you can get the pressure where you want.

Another way to look at this is that the zone of meh is a very long transition zone from one turn to the next.

If you ski this way, you may be unhappy with your speed control as the meh zone isn’t doing much to control your speed and you only generate decent edge angles at the end of the turn.

Effective Carving

image

The difference in this diagram is all at the transition. We go from the end of the turn where we have the old outside ski behind and more weighted to the start of the new turn where the *new* outside ski is behind and more weighted, and this happens fairly quickly. That allows us to immediately start carving on that new outside ski before the fall line and to have a higher edge angle by the time we get to the fall line. That gets out speed control that is more spread out.

The first thing required to get out of the zone of meh is to get the ski lead change done early in the transition, before you are curving down to the point down the fall line.

If you look at this PSIA medium carved turns video, you can see the ski lead change happening early in the transition. That’s what we are searching for.

Inside Ski Blocking

There’s a second issue in the meh zone that I call inside ski blocking.

image

At the turn finish, we have a mostly straight downhill leg and an uphill leg that is bent because it is higher up the slope. That is a good thing – that arrangement is what gives the edging that we use to carve the bottom part of the turn.

But that’s not the position we want for the new turn; to be on our edges early – before the fall line – we will need to rotate our skis so that we are on the opposite edge. The *downhill* edge.

That is the only way to get the skis carving through that portion of the turn.

The downhill (new inside) ski presents a problem; it has a strong edge in the snow and we need to get rid of that edge and move to the new one.

image

The first thing we are doing at turn initiation is straightening out the upper leg to get pressure on the ski. That reduces the pressure on the lower ski and that naturally leads to the body rotating downhill (the green arrow). However, that’s generally not enough to move the body downhill quickly enough, so we add in a movement where we actively move the downhill knee down the hill. That will pull the center of gravity downhill and put the body into the desired position.

Go back to the video and look at the turn that starts at about 1:44 in the video, focusing on the knees. Note how the downhill knee crosses over from being on the uphill side of that ski to the downhill side of that ski as part of the transition.

Oversteering

There’s one more technique to use to get on the new edges that I call oversteering (there may be a real name that I’m not aware of).

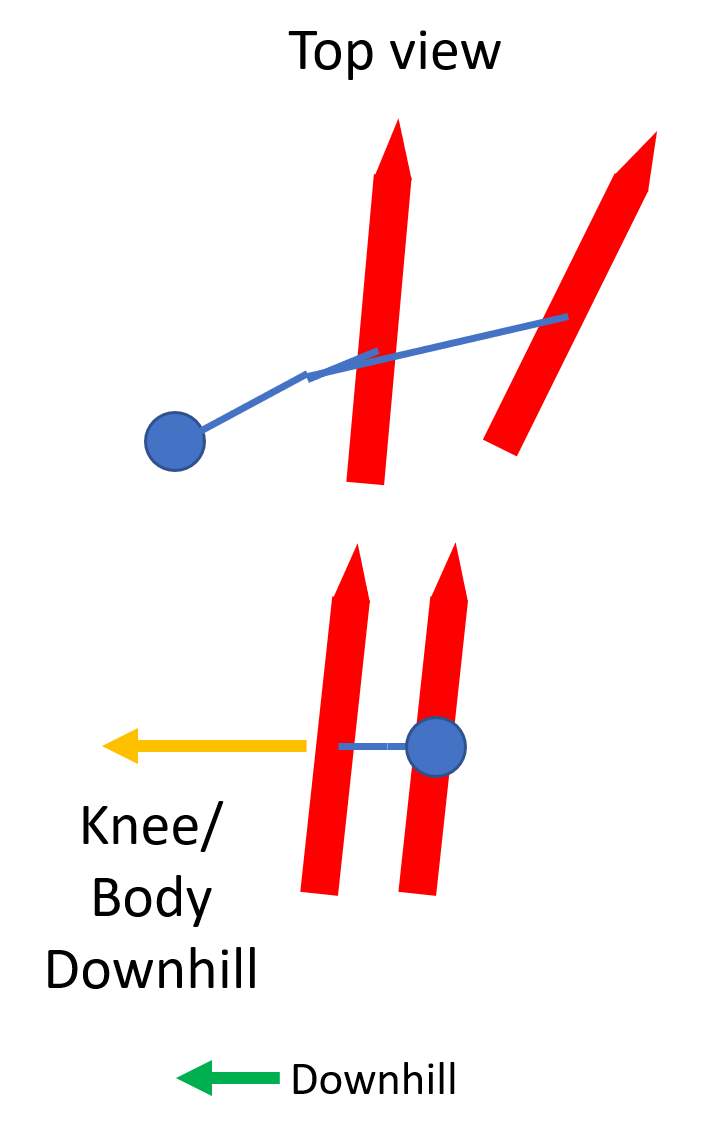
Here’s a top view of our current approach shown looking down from above.

At the end of our turn our head and body is balanced over the uphill ski so that we can have both skis on edge. Then to release that edge and get on the other edge, we shift the inside knee and therefore the whole body – including the center of gravity below the downhill ski. This works well, but that’s a fair bit of mass and it takes a little time to get that done.

image

Our goal is to get the center of gravity below the skis. It certainly works to move the body downhill, but we can also move the skis *uphill*. And because our skis and legs are a lot lighter than our body, this can happen faster than moving the body downhill – especially if we do both.

image

There is a downside. If the skis get too far up the hill or too far in front of us, we won’t be able to “catch” them on the new edges and we will simply fall over.

image

Turn radius

The turn radius that you choose has a big effect on technique. If you are doing big long-radius turns, you can do them without a whole lot of movement; you don’t need big changes in ski lead and therefore you probably don’t need knee initiation. You can do most of it just with ankles.

Medium radius is going to require more activity on both ski lead and the knees to get the transition to happen quickly enough.

Short radius turns use pretty much the same technique as medium radius ones but can definitely benefit from a little bit of oversteer (or overedge) as that will really pop the skis across into the new turn. When you fall down, you’ll know that you went too far.

Exercises

I really like the one-ski lift the tail exercise I describe in the other write-up. Get into a traverse, lift the tail of the new inside ski 3” off the snow, and then just let your body move downhill and into the turn. The reason this one works so well is that to get the tail of the inside ski up you must have weight on front of the new outside ski or it doesn’t work. Do this on an intermediate slope where you are comfortable; it is going to take time to get used to a turn initiation that is much less active than the one you are used to.

If you have trouble with the position, go back and do the forward sideslip exercise. One more thing to check is your ski spacing; if you ski with your skis very close together you can’t get the angles you want because your knees will bump into each other. Note the ski spacing of the yellow skier in the video.

Focus on what I would call “big swoopy turns”; you should be nearly across the fall line at the end of each turn. This is sometimes called “skiing the slow line fast”; you are taking a path that is much longer and therefore looks slower but because you are carving you are carrying a lot of speed.


I feel sorry for the Video Only Couple…

I’m feeling sorry for the Video Only couple. It’s not because of their obsession with video equipment, though perhaps a pastime such as golf or trainspotting would lead to a more balanced view of the world.

I see no justification of them to be stuck with the sisyphusian task of determining the optimal commercial establishment to procure new video equipment over and over again; one cannot help but compare their predicament with that of Phil Conners (so ably portrayed by Bill Murray) in Groundhog day, but despite the forced repetition of the same day, the aforementioned Conners was still able to achieve real character growth despite the obvious constraints of his situation.

Jane and Doug – as I have taken to calling the couple – are destined to be eternally dissatisfied with their current equipment in their endless task of keeping up with their neighbors, endlessly researching prices on the internet and at other retailers, only to ultimately discover the advantages of Video Only. We follow their voyage of discovery, wondering if they will achieve their goal despite the obstacles in the way, and finally cheering their success, while still knowing in our hearts that their victory is Pyrrhic and confers no lasting benefit.


Larson Scanner, Servo Edition

A while back I did a post – and a video – about the Fade animation system that I had built. It runs on an ESP32 and support both PWM and WS2812 LEDs.

One of my commenters asked me whether it would be possible to use that system to drive servos for an art project – 40 servos if I recall correctly.

My response was twofold…

First, servos support should be easy

Second, the ESP32 only has 16 PWM channels, so supporting 16 channels would be easy but it would be harder to go farther.

So the answer was no. But it got me thinking…

Adding servo support was a bit of a pain – see Servos Suck for why I was wrong – but I got it working, at least working well enough. And I added support to the Fade Simulator for servos, so you can graphically see where the servos are pointed.

More channels was a bit more fun. Basically, what I needed was a way for the system to have both local – on chip – device support (ie PWM or WS2812) and remote (to another system) device support. Nicely, the same architecture that lets the system support both PWM and addressable LEDs can let the system support a network device. So I added an Udp led device that takes a number of channels of animation and sends them out over the network. Then there’s a network reader that runs on the second device to pull the animation data off the network and use it to drive the local devices.

This worked pretty well, and I ended up with a new feature for WinFade; you can run the Fade code on your windows machine and use it to drive your actual hardware over the network. This makes development quicker; I don’t even need to download the changes to the ESP32 to test them out.

So that all was great, but I needed a demo.

And I came up with a bit of a stupid idea.

I grew up in the 1970s and 1980s, and since there wasn’t a ton to do we would watch bad TV at time, including Knight Rider.

In that period, anything that used LEDs was by definition cool, and KITT – the car in Knight rider – had a bunch of them, including a Larson Scanner on the front that bounced back and forth.

In the 1970s we were easily impressed. As Douglass Adams wrote in Hitchhiker’s:

“Far out in the uncharted backwaters of the unfashionable end of the western spiral arm of the Galaxy lies a small unregarded yellow sun. Orbiting this at a distance of roughly ninety-two million miles is an utterly insignificant little blue green planet whose ape-descended life forms are so amazingly primitive that they still think digital watches are a pretty neat idea.”

Building your own Larson Scanner was a cool accomplishment in the 1980s, so of course I had built one before. Fade supports them with just a few lines of code. But I did some searching and found out – based on a very cursory search – that nobody had build a physical Larson Scanner, presumably because it was a dumb idea without much utility.

That sort of thing is right in my wheelhouse – see “the worst 50 watt speaker in the world

image

A bit of time in Fusion 360, and I had a design. The box is made of laser-cut 3mm plywood, and the balls are ping-pong balls. Not surprisingly, the first version wasn’t quite right, but the second version was fine. I painted one side of the balls red and the other side black.

Larson Scanner

Hiding in back is the ESP32 board that connects to the 16-channel servo breakout board that I built.

In addition to the 16 servo connections, the rest of what I think are the useful pins are also brought out to headers.

If you are interested in this board, ping me and I’ll put it on my Tindie store.


Fade–an ESP32 animation System

If you want to see the demo first, here’s the video:

If you just want the details, I’ve created a tutorial and language reference.

I’ve been building animated holiday decoration for over 20 years (playlist of videos here), and written a lot of animation code. As a (now former) software developer, I came up with a couple of different methods of expressing the animation.

None of them were very good.

I used a table-based approach – where the code just encoded every state change along with how long to pause between them. It was simple, easy to author, but didn’t handle dimming very well and wasn’t well suited for multicolor decorations.

I wrote a lot of custom code. That of course had a lot of expressiveness – you can write whatever you want – but it’s pretty clunky. Write the code, compile it, download it to your system, run it, take notes about how it’s working. Repeat until you get tired.

In either case, once it gets deployed out in the yard it’s more painful to make changes. Open the enclosure, take out the controller board, go back inside to the office, download new code, take it back outside, etc.

Then I started using ESP8266 microcontrollers. They’re pretty capable and they can host a web server. I wrote a system where the animation was custom code and it could also be driven over the network by a desktop or laptop. That worked pretty well, but I still had to bring the hardware inside to reprogram it.

Then I started using the ESP32, which is cheap, has great features for animations (16 channels of PWM, all done in hardware, plus addressable LED support, plus a ton of other things), is dual core, runs fast, and has a lot of memory. It *is* possible to update code over the WiFi link, so you can do it remotely. But that still left me writing in C++ and dealing with a slow development cycle.

So, I decided to build a language that ultimately ended up being called “Fade”. I actually built it twice; the first version worked but the parsing approach was decidedly inelegant. It now features a nice recursive-descent parser.

The current system hosts a very simple web-based IDE that displays the current code on the microcontroller. Make changes, hit send, and the new code is shipped over to the ESP32 which reboots and starts executing. It’s much, much faster and I did a nice 16-channel skiing penguins display with it. I could tweak the code using my laptop in the garage, download it, and just walk outside and see how it was working.


image

But… there was still a problem. The web-based IDE wasn’t great, and I didn’t have a great way to get the code saved and into version control. If the microcontroller died I’d have to rewrite it.

That got me thinking, and I wrote WinFade, a Fade authoring environment that runs on Windows. It has a nicer editor with primitive intellisense and can save the code away in files for version control and later use. Write your code, download it to the ESP32.

image

The cooler part is that WinFace hosts the same animation code that runs on the microcontroller, so that you can test the animations that you write in the IDE before you ship it down to the microcontroller. And that’s both faster and easier.

image

It supports strips, rings, matrices, and custom arrangements of LEDs, so you can get the physical layout that you actually use in your project.

It even supports custom LED arrangements, so you can use it for projects like my RGB Snowflakes:

image

User Interaction

Fade supports some user input. The ESP32 has built-in support for touch buttons, and those can be used from the Fade Language. It also supports traditional touch buttons. The buttons can also be controlled remotely by hitting a specific URL on the microcontroller; this allows for both local and remote support.


Observational Studies and causation

There’s a problem with observational studies.

Let’s say you tell people to do something – eat less red meat, for example – you are hoping to change their behavior. You end up with some people who totally avoid red meat, some people who reduce the amount of red meat they eat, and some people who just ignore you.

Then you come back 10 or 20 years later and do an observational study and look at how much red meat people eat and how healthy they are, and – lo and behold – you find out that those people who eat less red meat are healthier.

So, you publish your study and a bunch of other people publish their studies.

Unfortunately, there’s a problem; the act of telling people what to do is messing with your results. The people who listened to your advice to give up red meat are fundamentally more interested in their health than those that didn’t listen in a myriad of ways. Those differences are known as “confounders”, and studies use statistical techniques to reduce the impact of confounders on the results, but they can never get rid of all the confounders. Which leaves us with a problem: we don’t know big the residual confounders are in comparison with any real effect we might be seeing.

Residual confounding is why those studies can never show causality; if you look at the studies themselves, they will say there is an association with red meat consumption and increased mortality.

But in the press releases from the research groups or universities, causality is often assumed.


The endurance athlete’s guide to fueling and weight loss part 3: Carbohydrate and Fat use in actual athletes…

Please read the introduction and earlier posts if you haven’t…

After two posts of biochemistry, we will *finally* get into some real-world stuff in this post. Thank you for your patience; this is where it gets interesting…

My goal in this post is to talk about what carbohydrate and fat usage looks like in real athletes. How do we do that? Well, luckily the chemistry that is in play when burning glucose (glycolosis) and burning fat (beta oxidation) is different, and it turns out that the amount of carbon dioxide produced for a given amount of oxygen differs between the two. That is expressed as a number known as the “respiratory quotient”.

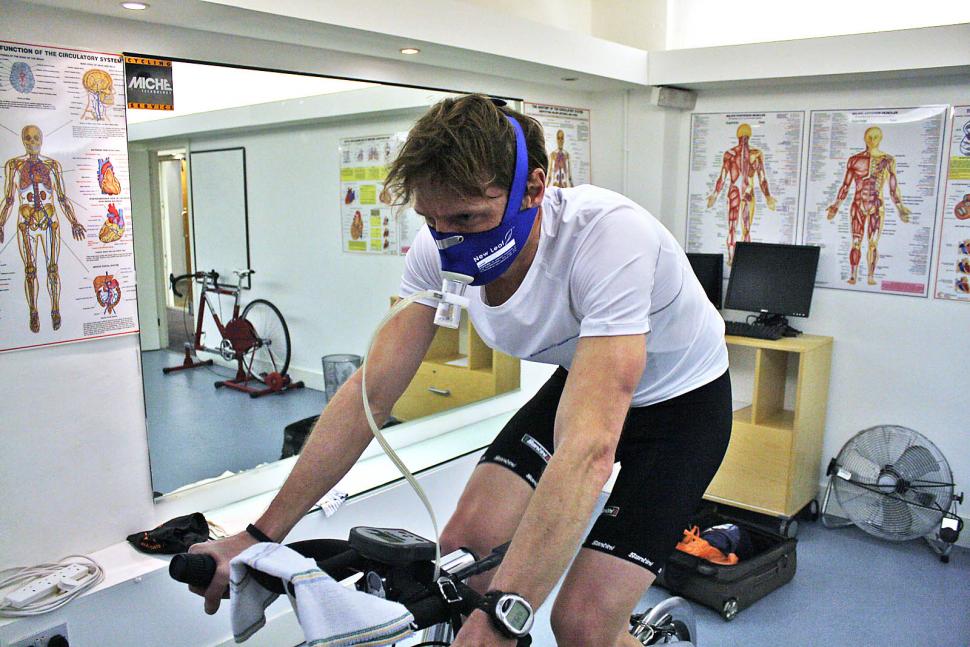
This is pretty cool. It means we can take an athlete and hook her up to a machine that analyzes the gases that she exhales, and it can tell us how much of her energy is coming from burning fat and how much is coming from burning glucose.

And, if she is on an exercise bike, we can also figure out how much power she is producing, so we can correlate that to the fat and glucose percentages. The setup looks like this, and is commonly done as part of a VO2Max test.

Image result for vo2 max analyzer

Fat and Carbohydrate burn versus intensity

What we would like is a chart that shows the percentage of energy that comes from fat and the percentage that comes from carbohydrate at various intensities. If you’ve ever taken an exercise physiology class or looked into fat burning, you probably came across a chart like this:

Image result for fat versus carbs intensity

This chart says that we burn mostly fat at low intensities, and as the intensity goes up, the percentage of energy from fat goes down and carbohydrate (CHO) goes up. I’ve seen this chart in countless places. And I’ve seen passionate arguments about where you should set your intensity to get the best fat burn; does lower fat burn percentage at a higher intensity burn more fat? etc. etc.

The problem is that this graph is… well, I was going to say it was an idealized model, but I think the term “absolute fabrication” is more correct.  I spent some time tracking down where it came from once, and I think it might have come from a misunderstanding around this article, but it does not reflect reality for pretty much anybody. So any conclusions we might draw from a graph like this will not be worth much.

You might remember in the introduction I talked about being confused by the fact that some endurance athletes carry a lot of extra fat? It was confusion partly driven by this graph; if the graph were true, long bicycle rides at, say, 50% intensity would be great at fat burning for everybody, and we’d expect cycling would make it *easy* for people to lose weight. Right?

So, what do we really see, with actual athletes?

Let’s look at some real data (note 1) from an athlete doing a VO2Max test after an 8 hour fast. Measurements after an 8 hour fast will show an athlete at his or her fat-burning best.

image

The respiratory quotient is calculated at different points during the test, and then the percentage of power from fat and glucose (labelled “CHO” for carbohydrate) is calculated for each point. The amount of power produced is converted to a watts / kg measure using the rider’s weight.

What can we tell from this graph? Well, even in the best conditions for burning fat – after a fast – this athlete doesn’t get more than 25% of his power from the beta oxidation of fat. Even at low intensities, he is getting 75% of his energy from the glycolysis of glucose. I call this pattern “Carb optimized”; great at burning carbs, poor at burning fat.

What causes this pattern? Well, I’ll get more into that later, but as a hint, the source noted that this athlete had a “sweet tooth” and regularly consumed high amounts of refined sugary foods.

Implications

What impact does the heavy reliance on carbohydrates for energy have on this athlete?

I don’t know the rider weights in this data, but let’s just assume the rider is on a long ride at a moderate intensity – say 150 watts. Remembering that 100 watts is roughly 360 calories per hour (note 2), that means at 150 watts, the rider is burning 360 * 1.5 = 520 calories per hour. Of these calories, 390 (75%) come from carbs and only 130 (25%) from fat. And let’s say this rider starts with full muscle glycogen stores of 400 grams = 1600 calories of energy. How long will this rider be able to ride before running out of stored glycogen?

Time until running out of glycogen = 1600 / 390 = 4 (ish) hours

Even at a very moderate intensity, this rider is going to run out of stored glycogen in only about 4 hours (note 3). And then bonk. Having bonked as a high-carb athlete, I can tell you that it is no fun; you lose the majority of your power. Which is no surprise at all looking at the graph; this athlete really needs carbs to put out power.

The glycogen depletion will happen faster at higher intensities; not only is the rider burning more calories per hour, he is also burning a higher percentage of glycogen to get those calories. At 250 watts, it’s 675 calories from carbs per hour, which gives a time to depletion of a little over two hours.

It’s pretty clear that this athlete needs carbohydrate supplementation to continue to exercise so that he won’t totally deplete his glycogen. And if you go here, you will find numerous studies that tell you how great carbohydrate supplementation is for athletes and how much it improves their performance and endurance.

Hmm. Those studies are all linked from – and many are funded by – a company who’s business model is selling flavored sugar water in many and varied forms. The same business model used by most companies that make sports nutrition products. So you’ll forgive me if perhaps I venture to mention that maybe – just maybe – things are a bit more complicated than that.

Keep that thought in the back of your head.

If you do long events, you may have found out that carbohydrate supplementation can cause issues:

  1. If you eat before a ride or try to carb load, you will put yourself into a high-glucose state which will turn off fat metabolism and increase your carb burn percentage.
  2. You are limited in how much food you can digest during exercise because of limitations of blood flow – the blood that is going to your muscles to power them is blood that isn’t available to send to your stomach. This gets worse as the intensity goes up, and can easily make you feel sick.
  3. If your sport involves impact – like running – the mechanics of impact can make it harder to digest food and make it more likely you will have what are politely known as “gastrointestinal issues”.
  4. Trying to balance the need for energy with the digestive issues can be difficult. Too much food and you feel sick. Too little food and you run out of energy.

I’ll use myself as an example. I used to be a low-fat diet carbs before/during/after cyclist, and I followed that advice religiously; even my short 25 mile rides had carbs during and after. Let’s have some fun with some of my data from that period…

(Author’s note: it turns out I used RAMROD data that did not include power data, so the calorie values are likely inflated by about 25%. I will correct it with better data when I get a chance; I do not think it changes the overall message of this section)

Back in 2013 I did a ride named RAMROD, which has about 9300’ of climbing over 150 miles. I have power meter data that ride, and it shows that I burned 5220 calories on the ride and it took me 9.9 hours on the bike to complete the ride, and 12.25 hours elapsed.

What can we do with this data? I charted my actual energy use by minute based on the recorded data, and it’s straight enough that a linear plot works fine, so I’m just going to say that I burned 5220 / 9.9 = 527 calories per hour (I’m using kj but when you factor in conversion and efficiency factors they are pretty much equal to calories).

image

That’s just what I burned moving the bike.  Looking a basal metabolic calculator, it says I burn about 1800 calories per day just sitting on my butt, or a further 75 calories per hour, for a total of 600 calories per hour, give or take.

If we look at both liver and muscle glycogen, I had something like 2000 calories in glycogen reserves. I’m a relatively tall guy with more than average muscle mass for a cyclist, so maybe it’s a bit more, but something in that range. If we assume that I’m getting 75% of my calories from carbs – that I look like athlete #1 – that would mean I’m burning 450 calories of glycogen per hour.

Which would mean I could expect to be able to ride 2000/450 = 4.4 hours before I totally ran out of glycogen.

This is a bit too optimistic… Muscle glycogen is allocated to individual muscles rather than sharable, so any glycogen in my arms, chest, or any other under-utilized muscles doesn’t keep my quads and calves from running out of glycogen. I don’t carry a lot of non-cycling muscle, so I’m going to make a guess that 25% of my muscle glycogen is in muscles that I’m not really using for the ride – or if I am using them, it’s not actually going to physically moving the bike forward. That would drop me down to 1600 calories in my glycogen stores, and 1600 / 450 = 3.6 hours.

I normally targeted 200-300 calories per hour while riding.

With all that in mind, what do my glycogen reserves look like during the ride?

image

The blue line shows what happens if I start with full glycogen reserves and eat 200 cal/hour of carbs, the orange if I eat 300 calories per hour. At 200 cal/hour, I will run out of carbs just before 7 hours, while at 300 cal/hour, it will be just before 11 hours.

This chart is by no means perfect, but it basically says that if I can eat 300 calories per hour I’m probably going to be okay until right near the end, but if I can only get in 200 calories per hour, I’m doomed to be really unhappy at around 7 hours in.

Hmm. It turns out that in RAMROD I would feel fine on the first 3000’ climb, but when I got to the second climb – at 92 miles and roughly 7 hours in – I was pretty sure to be a) feeling weak and b) feeling a bit sick to my stomach. Not really what you want when you have 3250’ of climbing in front of you, often in the summer sun and heat. And after being off the bike for an hour at the deli stop at 120 miles after that climb and getting a lot more food in me, I generally felt quite a bit better.

My assumption was always that I wasn’t well enough trained for a ride this long or hot – both of which are probably true – but from a fueling perspective, if I wasn’t eating enough I was going to be very unhappy. Compounding this is that it’s hard to fuel on a ride with big climbs; I can only eat a little on the climbs or you get sick, and trying to eat is contraindicated on mountain descents at 35 MPH.

What does all this mean?

If you get most of your energy from carbohydrates, you are going to have a deficit between what you burn and what you can replace, and you will eventually run out of stored glycogen. Remember when I talked about the asymmetry between the two systems? The limited supply of stored glycogen is a big issue on long events if you burn a high proportion of carbohydrates.

Another athlete

Back to the data. Here’s a second athlete:

image

Note that this athlete manages to get 40-50% of his power from fats up to about 3 watts/kg. What factor or factors do you think accounts for the difference in fat burning between these two athletes? Write down what you think is the cause, and I’ll continue in the next post.

Post 4: Better fat burning in actual athletes

Notes:

  1. All of the graphed data is from this excellent article from CyclingTips, though I have regraphed it.
  2. 100 watts is 100 joules per second, and there are 3600 seconds in an hour, so that would be 100 * 3600 = 360,000 joules per hour, or 360 kj per hour. Now we need to convert that to calories. One kJ is about 0.24 calories of energy, so that would mean 360 kj/hour is 90 calories/hour. However humans are 20-25% efficient in turning food energy into mechanical movement, so it takes about 4 * 90 calories/hour of food to get 90 calories/hour of work out. This is really just a very convenient coincidence, and because of it pretty much everybody just acts as if the kj/hour is the same as the calories/hour value. It’s close enough.
  3. It is actually worse than this. One of the interesting features of muscles is that while they can absorb glucose and store it as glycogen, they lack the biochemistry that would allow them to take that same glucose and release it back into the bloodstream. What that means is that the muscle glycogen in your biceps cannot be shifted to your legs.


Review: MITx: 16.885x–Engineering the Space Shuttle

This fall I decided to spend some of my free time doing something different, so I signed up for an Edx/MITx online course on the Space Shuttle.

It was fascinating. If you have any interest in the details of how the Space Shuttle from an engineering standpoint, you will love this course. The course is run/hosted by former astronaut and MIT professor of aeronautics and astronautics Jeff Hoffman, and wherever possible the actual lectures are done by ex-shuttle engineers or managers. Main engines? Lecture by J.R. Thompson, manager of the Main Engine Projects office at Marshall. Flight control system? Phil Hattis, one of the leads on the system. Mission control? Wayne Hale, flight director for 41 missions. Saturn and shuttle? Chris Kraft.

A brief overview:

Section 1: How the Space Shuttle was Originally Designed and Approved

  • Lecture 1: Origins of the Space Shuttle – Dale Myers
  • Lecture 2: Development of the Space Shuttle – Aaron Cohen
  • Lecture 3: Early History of the Shuttle and NASA’s Relationship with the Military – Bob Seamans
  • Lecture 4: Political History of the Space Shuttle – John Logsdon
Section 2: Space Shuttle Sub-Systems
  • Lecture 5: Introduction to Space Shuttle Orbiter Subsystems – Aaron Cohen
  • Lecture 6: Orbiter Structures & Thermal Protection System – Tom Moser
  • Lecture 7: Space Shuttle Main Engines – J.R. Thompson
  • Lecture 8: Space Shuttle Aerodynamic Design – Bass Redd
  • Lecture 9: Aerothermodynamics – Bob Ried
  • Lecture 10: Space Shuttle OMS/RCS APU/Hydraulics – Henry Pohl
  • Lecture 11: Thermal Control and Life Support System – Walt Guy
  • Lecture 12: Mechanical Systems and RMS – Alan Louviere
  • Lecture 13: Shuttle Flight Control System – Phil Hattis
  • Lecture 14: Systems Engineering Review, Matrix Management, and Cost Estimation – Aaron Cohen

Section 3: Operating the Space Shuttle

  • Lecture 15: Space Shuttle Training and Mission Description – Jeff Hoffman
  • Lecture 16: Payload Operations and Systems Engineering – Tony
  • Lecture 17: Space Shuttle Launch Operations – Bob Sieck
  • Lecture 18: Space Shuttle Abort Modes, Payload Bay Doors, EVA – Jeff Hoffman
  • Lecture 19: Mission Control – Wayne Hale
  • Lecture 20: Test Flying the Space Shuttle – Gordon Fullerton
  • Lecture 21: Columbia Accident – Sheila Widnall
  • Lecture 22: Hubble Space Telescope and the Space Shuttle – Jeff Hoffman
  • Lecture 23: Apollo and the Space Shuttle – Chris Kraft
  • Lecture 24: Retrospective on the Space Shuttle – Jeff Hoffman/John Logsdon/Wayne Hale


Pages:1234567...15