Please read the introduction and earlier posts if you haven’t…
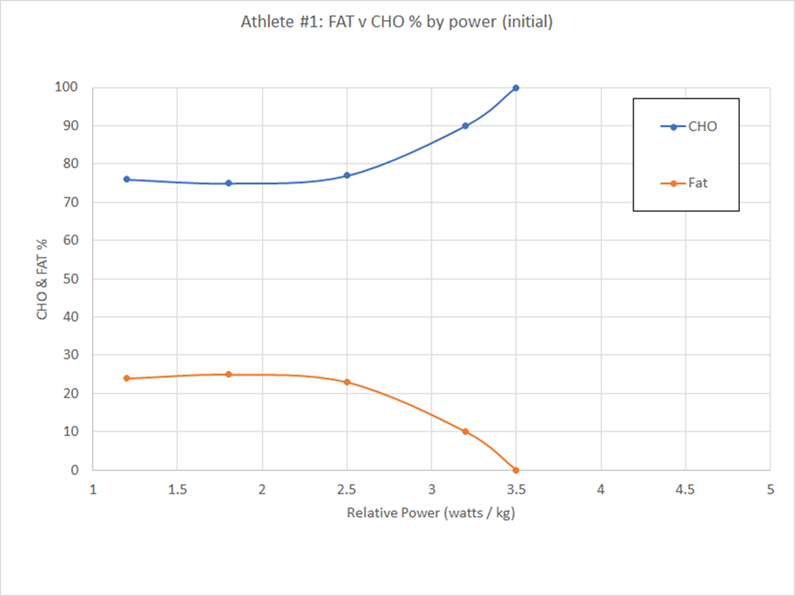
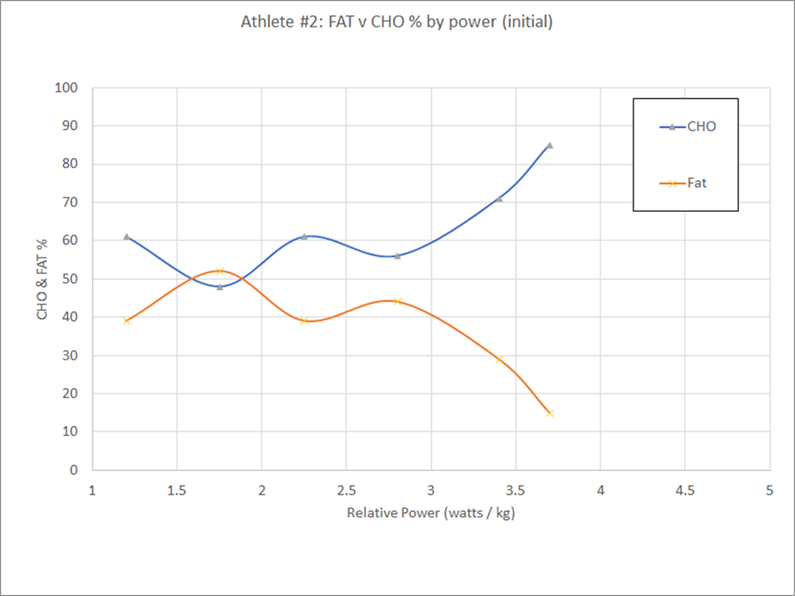
In the last post, I finished by asking what factor or factor might cause the difference between these two athletes:
The differences might be genetic, differences in diet, or differences in training. Or maybe something else. What do you think is at play?
We don’t know all the factors, but it turns out that this athlete does not have a sweet tooth, so he eats closer to the recommended cyclist diet; lots of carbs, but not a ton of sugar. At least in his base diet; I don’t know what he eats before/during/after training. And he’s better at burning fat.
Hmm. It’s almost as if there might be a dietary effect here, that the availability of carbohydrate in the diet and on the bike might have an effect on fat burning ability. How could we test that?
Well, let’s put two cyclists – how about these two cyclists? – in a situation where there is much less carbohydrate available, let them train for 10 weeks, remeasure their VO2Max, and see what changes. Since we want to maximize the effect, we’ll put them on a very low carb “keto” diet, which is something like 30 grams of carbs per day.
What happens?
Well, athlete #1 is not happy on the keto diet, and that’s really no surprise; he’s not good at producing energy from fat *at all*. If you take away his carbs he will feel horrible on the bike. He ends up making the following adjustments from has previous diet:
Not really a low-carb diet, but certainly a *lower than before carb* diet.
Ten weeks of training go by, he retakes the test, and we generate a new graph (previous results are dotted):
This athlete is now a significantly better fat burner; rather than hitting only 25% of calories from fat, he’s averaging 40% or so across most of his range. His beta oxidation system is better.
Athlete 2 started with the same very-low-carb diet, and he didn’t stick to it strictly either, but he did mostly get rid of grains and fruit from his diet, and he ended up lower-carb than athlete 1.
10 weeks go by, and we get this:
Yowsa! He nearly doubled the amount of energy he got from fat in parts of his range, and averages over 70% for most of the range. There is also a significant shift to the right, and he produces a higher maximum relative power. That’s great, the low carb diet made him much more powerful!
Not so fast. Remember that this is *relative power*, and we know that he lost some weight as part of his 10 weeks training, so most of the improvement is likely from the reduction in weight. Though the training may also have helped.
What did we see across these two athletes?
First – and most importantly – we saw that a dietary switch made significant changes in the fat metabolism ability for both athletes. This really isn’t very surprising knowing what we know about the underlying biochemistry, but it does show very clearly that beta oxidation capability can be trained.
Second, we saw a correlation between the amount of carbohydrate in the diet and the overall ability to metabolize fat.
I do want to add a few caveats. The first is that two cyclists is a very low sample size, and the second is that we can’t tell the difference between changes due to base diet and changes due to food before/during/after. And there may be a genetic component at play here.
Returning to my RAMROD example from the last post, let’s add in two more lines, corresponding to getting 50% of calories from carbs and supplementing 200 cal/hour (yellow) and getting 25% from carbs and supplementing 25 cal/hour (blue). These lines are closer to the “after” graphs of the two cyclists.
If I can get up to 50% fat utilization and supplement at 200 calories per hour, I should be able to go 12 hours without running out of glycogen. And if I can get up to 75% from fat, I can supplement at only 25 calories per hour and still easily make it to 12 hours. I can almost get to 12 hours without eating anything at all…
It may be better than that. Remembering back to the first post where we talked about triglycerides, and how those are composed of a glycerol backbone with three fatty acids attached to it. If we are burning lots of fatty acids in beta oxidation, that means the fat cells are breaking apart triglycerides, and that means we have a lot of extra glycerol around.
Since the body doesn’t want to waste energy, it will try to use the glycerol for something useful, and it can turn it into glucose through gluconeogenesis. That means if we are burning a lot of fat, we will get some glucose out of it to support the glycolysis side. And no, I don’t know how much “some” turns out to be, this is hard to study.
Some more data
Is there more data out there that would be interesting?
Jeff Volek and Stephen Phinney have done a number of studies looking at low-carb/keto diets and athletes (note 1), and here’s one that I think is relevant to this topic:
Metabolic characteristics of keto-adapted ultra-endurance runners
One of the problems with dietary studies is that the studies are expensive and time is limited, so it’s very hard to do studies where you change an athlete’s diet and check to see how it affects her for the next 12 months. That is why many of the studies around keto diets and athletes are extremely short; less than 3 weeks. Knowing what we know about how long it takes to achieve training gains in general, it’s pretty clear that 3 weeks is on the short side to see adaptations, so I don’t think most of those studies are very good.
In this study, Volek and Phinney instead looked at two groups of elite ultra-endurance runners, 10 who followed a high-carb diet, and 10 who followed a low-carb diet. Since each group was on their habitual diet, it’s a pretty good bet they were adapted to it pretty well. I will note at the outset that this is an observational study and therefore there is the possibility that the runners who chose low-carb are genetically better at burning fat than the high-carb ones.
From the hypothesis about trainability, what difference would we expect to see in fat burning rates between the two groups? Here’s the first graph:
The graph shows the peak fat oxidation during a 3-hour run for all of the athletes. Every low carb athlete is significantly better at burning fat than even the best fat-burning high carb athletes. If we look at the averages (circles to right), the average in the low carb group was 2.3 times higher than the high-carb group.
I’d also like to note that the average for the low carb group was 1.54 grams/minute. That would be 92.4 grams/hour, or a whopping 92.4 * 9 = 832 calories / hour from fat burning alone.
Where did that peak fat oxidation occur? Here’s another graph:
Here we are looking at the relative intensity of that fat peak for each runner; the HC group peak was at 54.9% of VO2max, and the LC group peak was at 70.3%. Not only are the low carb athletes burning more fat, they are hitting their peak at a higher intensity.
It is pretty clear that the low carb athletes are burning vastly more fat during a long run than the high carb athletes. And this study was with elite athletes doing ultra-distance events, which means even the high-carb athletes are likely to be decent fat burners.
There are some other interesting graphs in the paper that I recommend looking at (note 2), and we may come back to it later.
Summary
We found out that there seems to be a strong training effect and we can expect to improve the rate at which we burn fat through training. We also learned that if we can do that, it can make fueling more straightforward on long rides; we may need to still supplement, but likely not as much.
In the next post, we’re going to take a little excursion into talking about weight loss and hunger.
Notes:
- Phinney and Volek have written a couple of books that cover this same subject area: “The Art and Science of Low Carbohydrate Living” and “The Art and Science of Low Carbohydrate Performance”.
- Section 3.2 talks about submaximal substrate utilization, and features two charts that show the average oxidation rates (in grams/minute) for both fats and carbohydrates. The low carb group was very steady across the whole 180 minutes of the run; both fat and carbohydrate utilization is nearly a flat line. The high carb group saw a drop in carbohydrate and increase in fat over time; they also saw a slight reduction from 13.2 cal/minute at the start of the run to 12.0 cal/minute at the end.


So, what do you think ?